加载所需R包
rm(list = ls()) setwd('D:\\map') #设置工作环境 #加载包 library(tidyverse) library(sf) library(ggspatial) 数据获取与加载
1、地图数据——从阿里云DataV可视化网站(可选择其他平台)下载格式为.json的地图数据:(网址:http://datav.aliyun.com/portal/school/atlas/area_selector)
map <- read_sf("中华人民共和国.json") 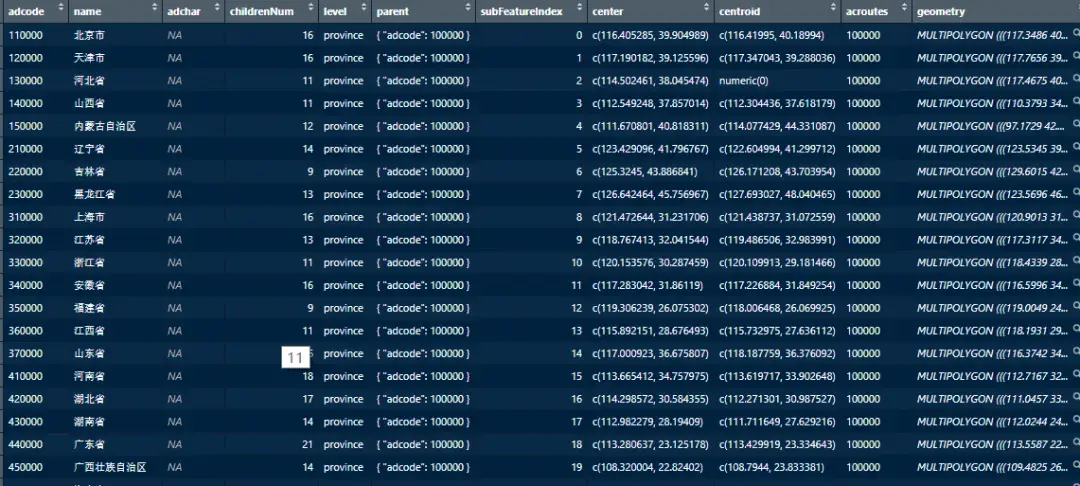
image.png
绘制地图
ggplot(map)+#数据 geom_sf(color='black',#线条颜色 fill=NA,#填充色 size=0.8)+#地图线条粗细 annotation_scale(location = "bl", width_hint = 0.3) +#添加比例尺并调整位置及长度 annotation_north_arrow(location = "tl", which_north = F, pad_x = unit(0.05, "in"), pad_y = unit(0.05, "in"), style = north_arrow_nautical)+#添加指北针,指北针类型style有north_arrow_orienteering;north_arrow_fancy_orienteering;north_arrow_minimal与north_arrow_nautical四种类型 coord_sf(crs = "+proj=laea +lat_0=40 +lon_0=104")+#坐标参考系统(CRS) theme(text = element_text(size = 14,face = "bold"), panel.background = element_rect(fill = NA), panel.grid.major = element_line(color = "grey",size=0.2), axis.line = element_blank())+ labs(x='', y='') 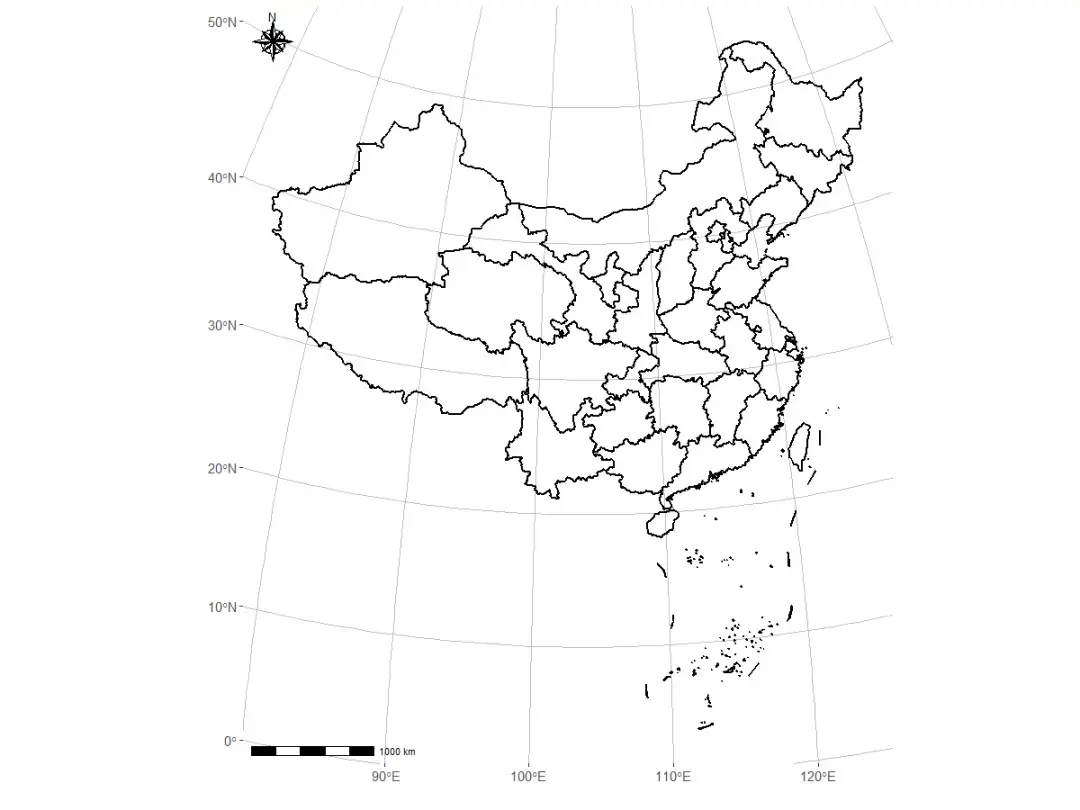
image.png
添加连续变量与分类变量数据
1、数据(数据为随机生成数据,无实际意义)
data <- read.csv("中华人民共和国.csv",header = T) 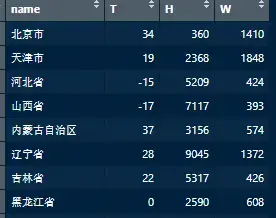
image.png
2、按照连续变量数据对地图进行填充
#合并数据并修正变量类型 data_all <- map %>% left_join(data,by = "name") %>% mutate_at("T", as.numeric) #绘图 ggplot(data_all)+ geom_sf(aes(fill=T),#填充 color='black',#线条颜色 size=0.8)+#地图线条粗细 geom_sf_text(aes(label = name, geometry = geometry), color = 'red', size=3)+#标签 scale_fill_gradient(low = "blue", high = "yellow")+#连续变量的填充 annotation_scale(location = "bl", width_hint = 0.3) +#添加比例尺并调整位置及长度 annotation_north_arrow(location = "tl", which_north = F, pad_x = unit(0.05, "in"), pad_y = unit(0.05, "in"), style = north_arrow_nautical)+#添加指北针 coord_sf(crs = "+proj=laea +lat_0=40 +lon_0=104")+#坐标参考系统(CRS) theme(text = element_text(size = 14,face = "bold"), panel.background = element_rect(fill = NA), panel.grid.major = element_line(color = "grey",size=0.2), axis.line = element_blank())+ labs(x='',y='') 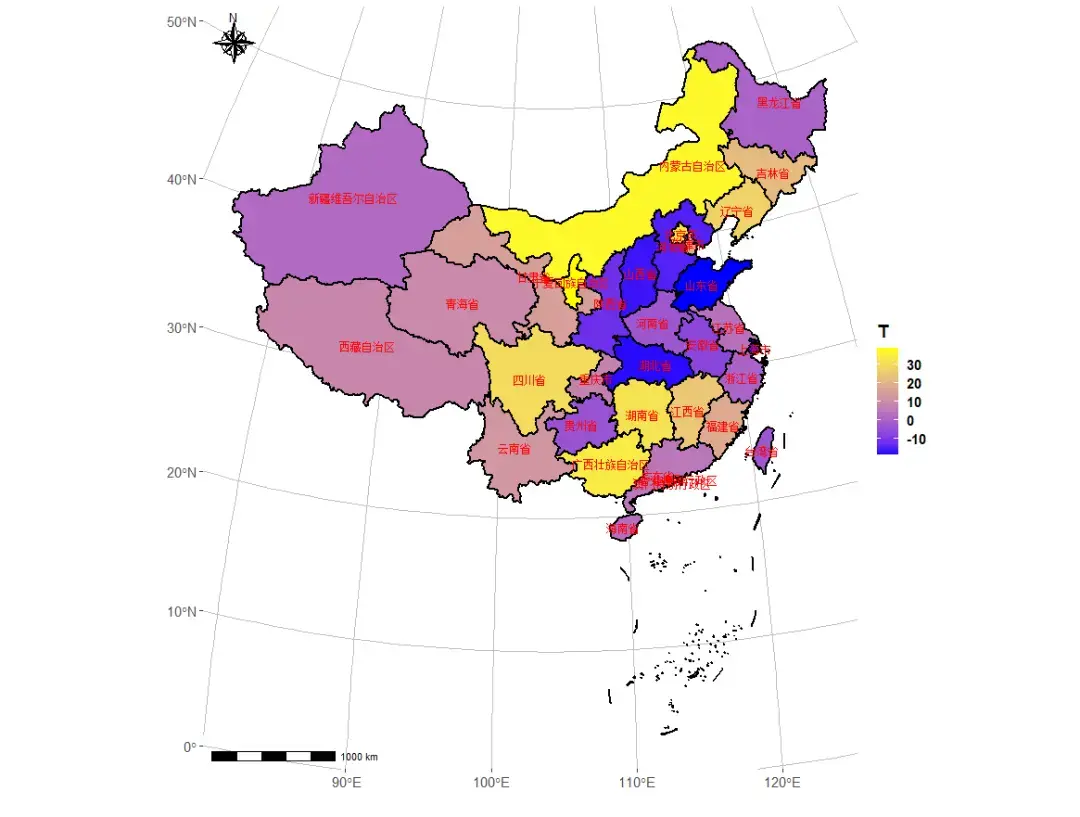
image.png
3、按照分类变量数据对地图进行填充
#分类变量数据 data_all <- map %>% left_join(data,by = "name") %>% mutate_at("H", as.character) #绘图 ggplot(data_all)+ geom_sf(aes(fill=H),#填充 color='black',#线条颜色 size=0.8)+#地图线条粗细 geom_sf_text(aes(label = name, geometry = geometry), color = 'red', size=3)+#标签 scale_fill_manual(values = rainbow(34))+#按照分类变量进行填充 annotation_scale(location = "bl", width_hint = 0.3) +#添加比例尺并调整位置及长度 annotation_north_arrow(location = "tl", which_north = F, pad_x = unit(0.05, "in"), pad_y = unit(0.05, "in"), style = north_arrow_nautical)+#添加指北针 coord_sf(crs = "+proj=laea +lat_0=40 +lon_0=104")+#坐标参考系统(CRS) theme(text = element_text(size = 14,face = "bold"), panel.background = element_rect(fill = NA), panel.grid.major = element_line(color = "grey",size=0.2), axis.line = element_blank())+ labs(x='', y='') 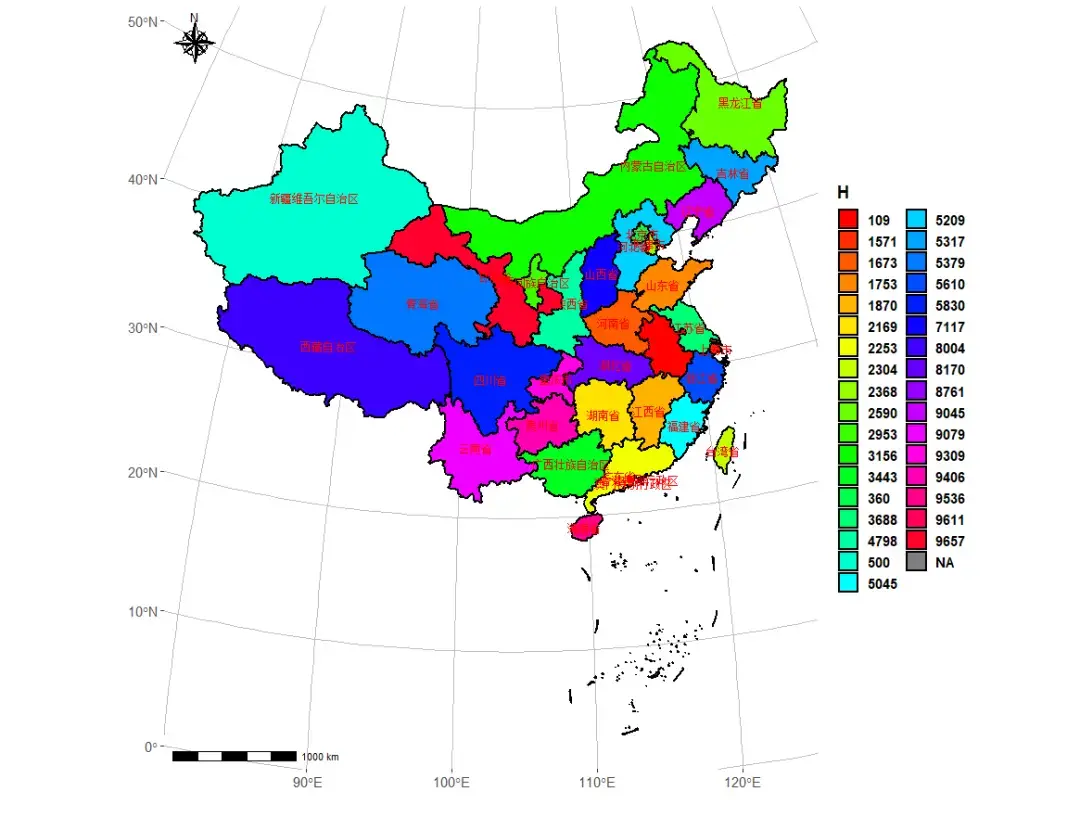
image.png
添加散点图
1、数据(随机生成,无实际意义)
df1 <- data.frame( lon=c(99,110,115,105,115,113), lat=c(35,28,35,28,38,25), group=rep(c('A','B'),3), value1=c(1.8,2.5,3.5,2.5,3,3.5), value2=c(3,3.5,6,5,4,4.5)) 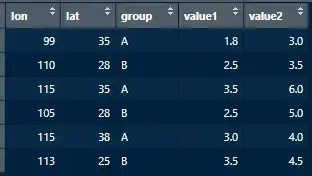
image.png
2、添加散点图
ggplot(map)+ geom_sf(color='black',#线条颜色 fill=NA,#填充色 size=0.8)+#地图线条粗细 geom_point(data=df1,aes(x=lon,y=lat,fill=group,size=value1),#散点图 shape=21, color='black', stroke=0.25)+ annotation_scale(location = "bl", width_hint = 0.2) +#添加比例尺并调整位置及长度 annotation_north_arrow(location = "tl", which_north = F, pad_x = unit(0.05, "in"), pad_y = unit(0.05, "in"), style = north_arrow_nautical)+#添加指北针 coord_sf()+#这里使用默认crs,否则需要对原始数据进行转换 theme(text = element_text(size = 14,face = "bold"), panel.background = element_rect(fill = NA), panel.grid.major = element_line(color = "grey",size=0.2), axis.line = element_blank())+ labs(x='', y='')+ scale_size(range=c(1,4))+#点的变化范围 scale_fill_manual(values = c("red", "yellow"))+#颜色 guides(fill = guide_legend(override.aes = list(size = 3),label.position = "right"))#图例设置 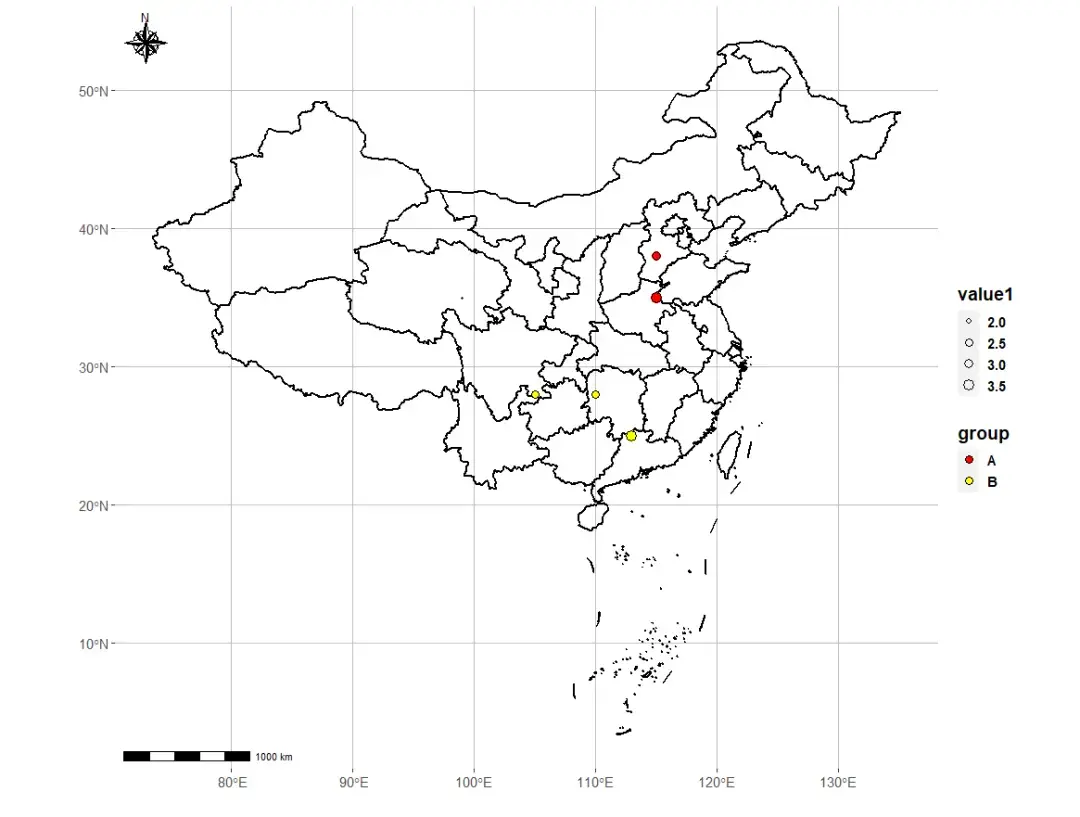
image.png
添加条形图
数据仍为散点图数据,绘图过程中不能使用常规geom_bar等函数进行绘制,可以使用geom_linerange()或geom_errorbar()函数进行绘制,绘图代码如下:
ggplot(map)+ geom_sf(color='black',#线条颜色 fill=NA,#填充色 size=0.8)+#地图线条粗细 geom_linerange(data=df1, aes(x=lon-.3,ymin=lat,ymax=lat+value1*0.3, color='A'), alpha=0.8,size=3)+#条形图1 geom_linerange(data=df1, aes(x=lon+.3,ymin=lat,ymax=lat+value2*0.3, color='B'), alpha=0.8,size=3)+#条形图2 annotation_scale(location = "bl", width_hint = 0.2) +#添加比例尺并调整位置及长度 annotation_north_arrow(location = "tl", which_north = F, pad_x = unit(0.05, "in"), pad_y = unit(0.05, "in"), style = north_arrow_nautical)+#添加指北针 coord_sf()+ theme(text = element_text(size = 14,face = "bold"), panel.background = element_rect(fill = NA), panel.grid.major = element_line(color = "grey",size=0.2), axis.line = element_blank())+ labs(x='', y='') 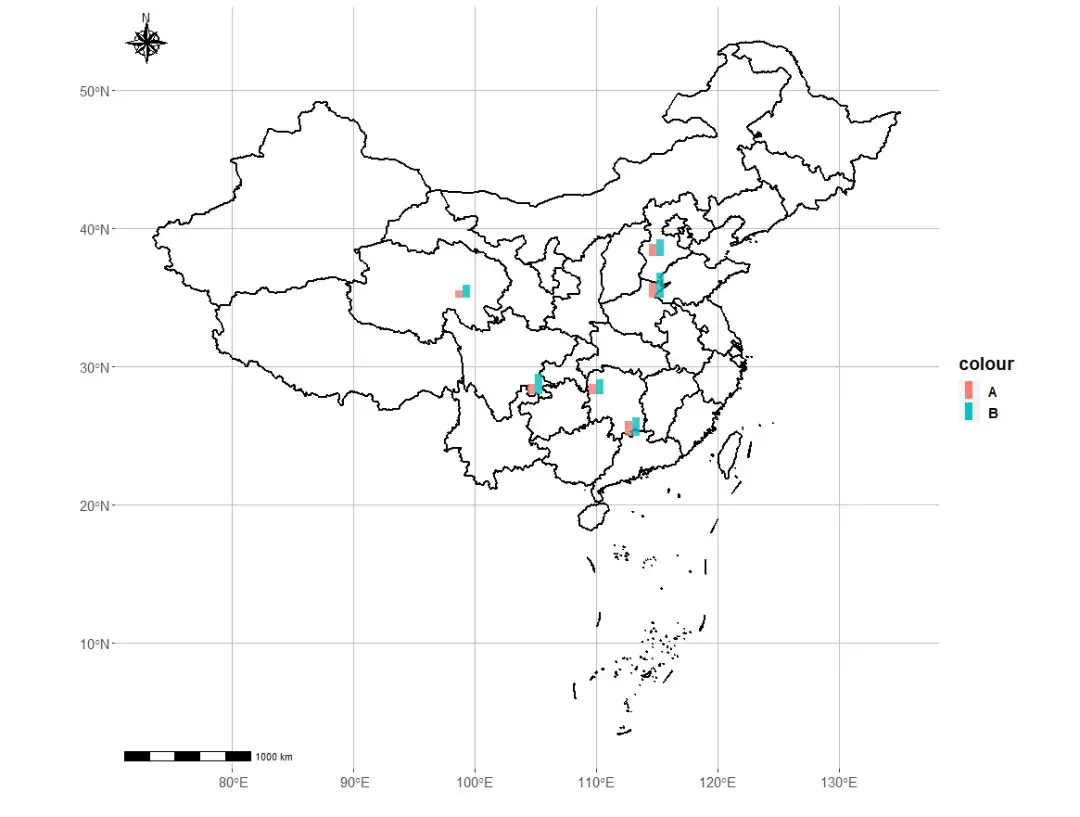
image.png